

JIGMAN™️ Process Costing Excel Tool
Take control of your business operations with this Excel-based Process Cost Spreadsheet, built specifically for small businesses, makers, department managers and Etsy sellers. This tool helps you break down and cost every part of your production/service processes—so you can see exactly where your time and money are going and how much time and money can be saved with improvement projects.
This spreadsheet gives you a clear, accurate understanding of the true cost of time in your business. Use it to analyse your processes, identify inefficiencies, and make smarter decisions about where to improve. When you can see the financial impact of small changes, you start to run your business differently—smarter, faster, and more profitably.
How it works
- Enter your yearly fixed costs and your employee details (hours worked). The tool calculates the cost of time in your business - per hour, minute and second. Only against the available working hours of your operation.
- Time the processes in your system, the tool gives you the cost per process, and creates a visual representation. Helping you identify and quantify your bottlenecks.
- Zoom in on your slower processes, breaking them down step by step. You are then able to hypothesise the effects of improvement activities in both time and money.
- Record the defects and errors in your operations and the time implications associated. The tool will quantify the impact these issues are having on your business.
What's included
You’ll receive a step-by-step instructional PDF and a fully
editable Excel spreadsheet with four practical sections:
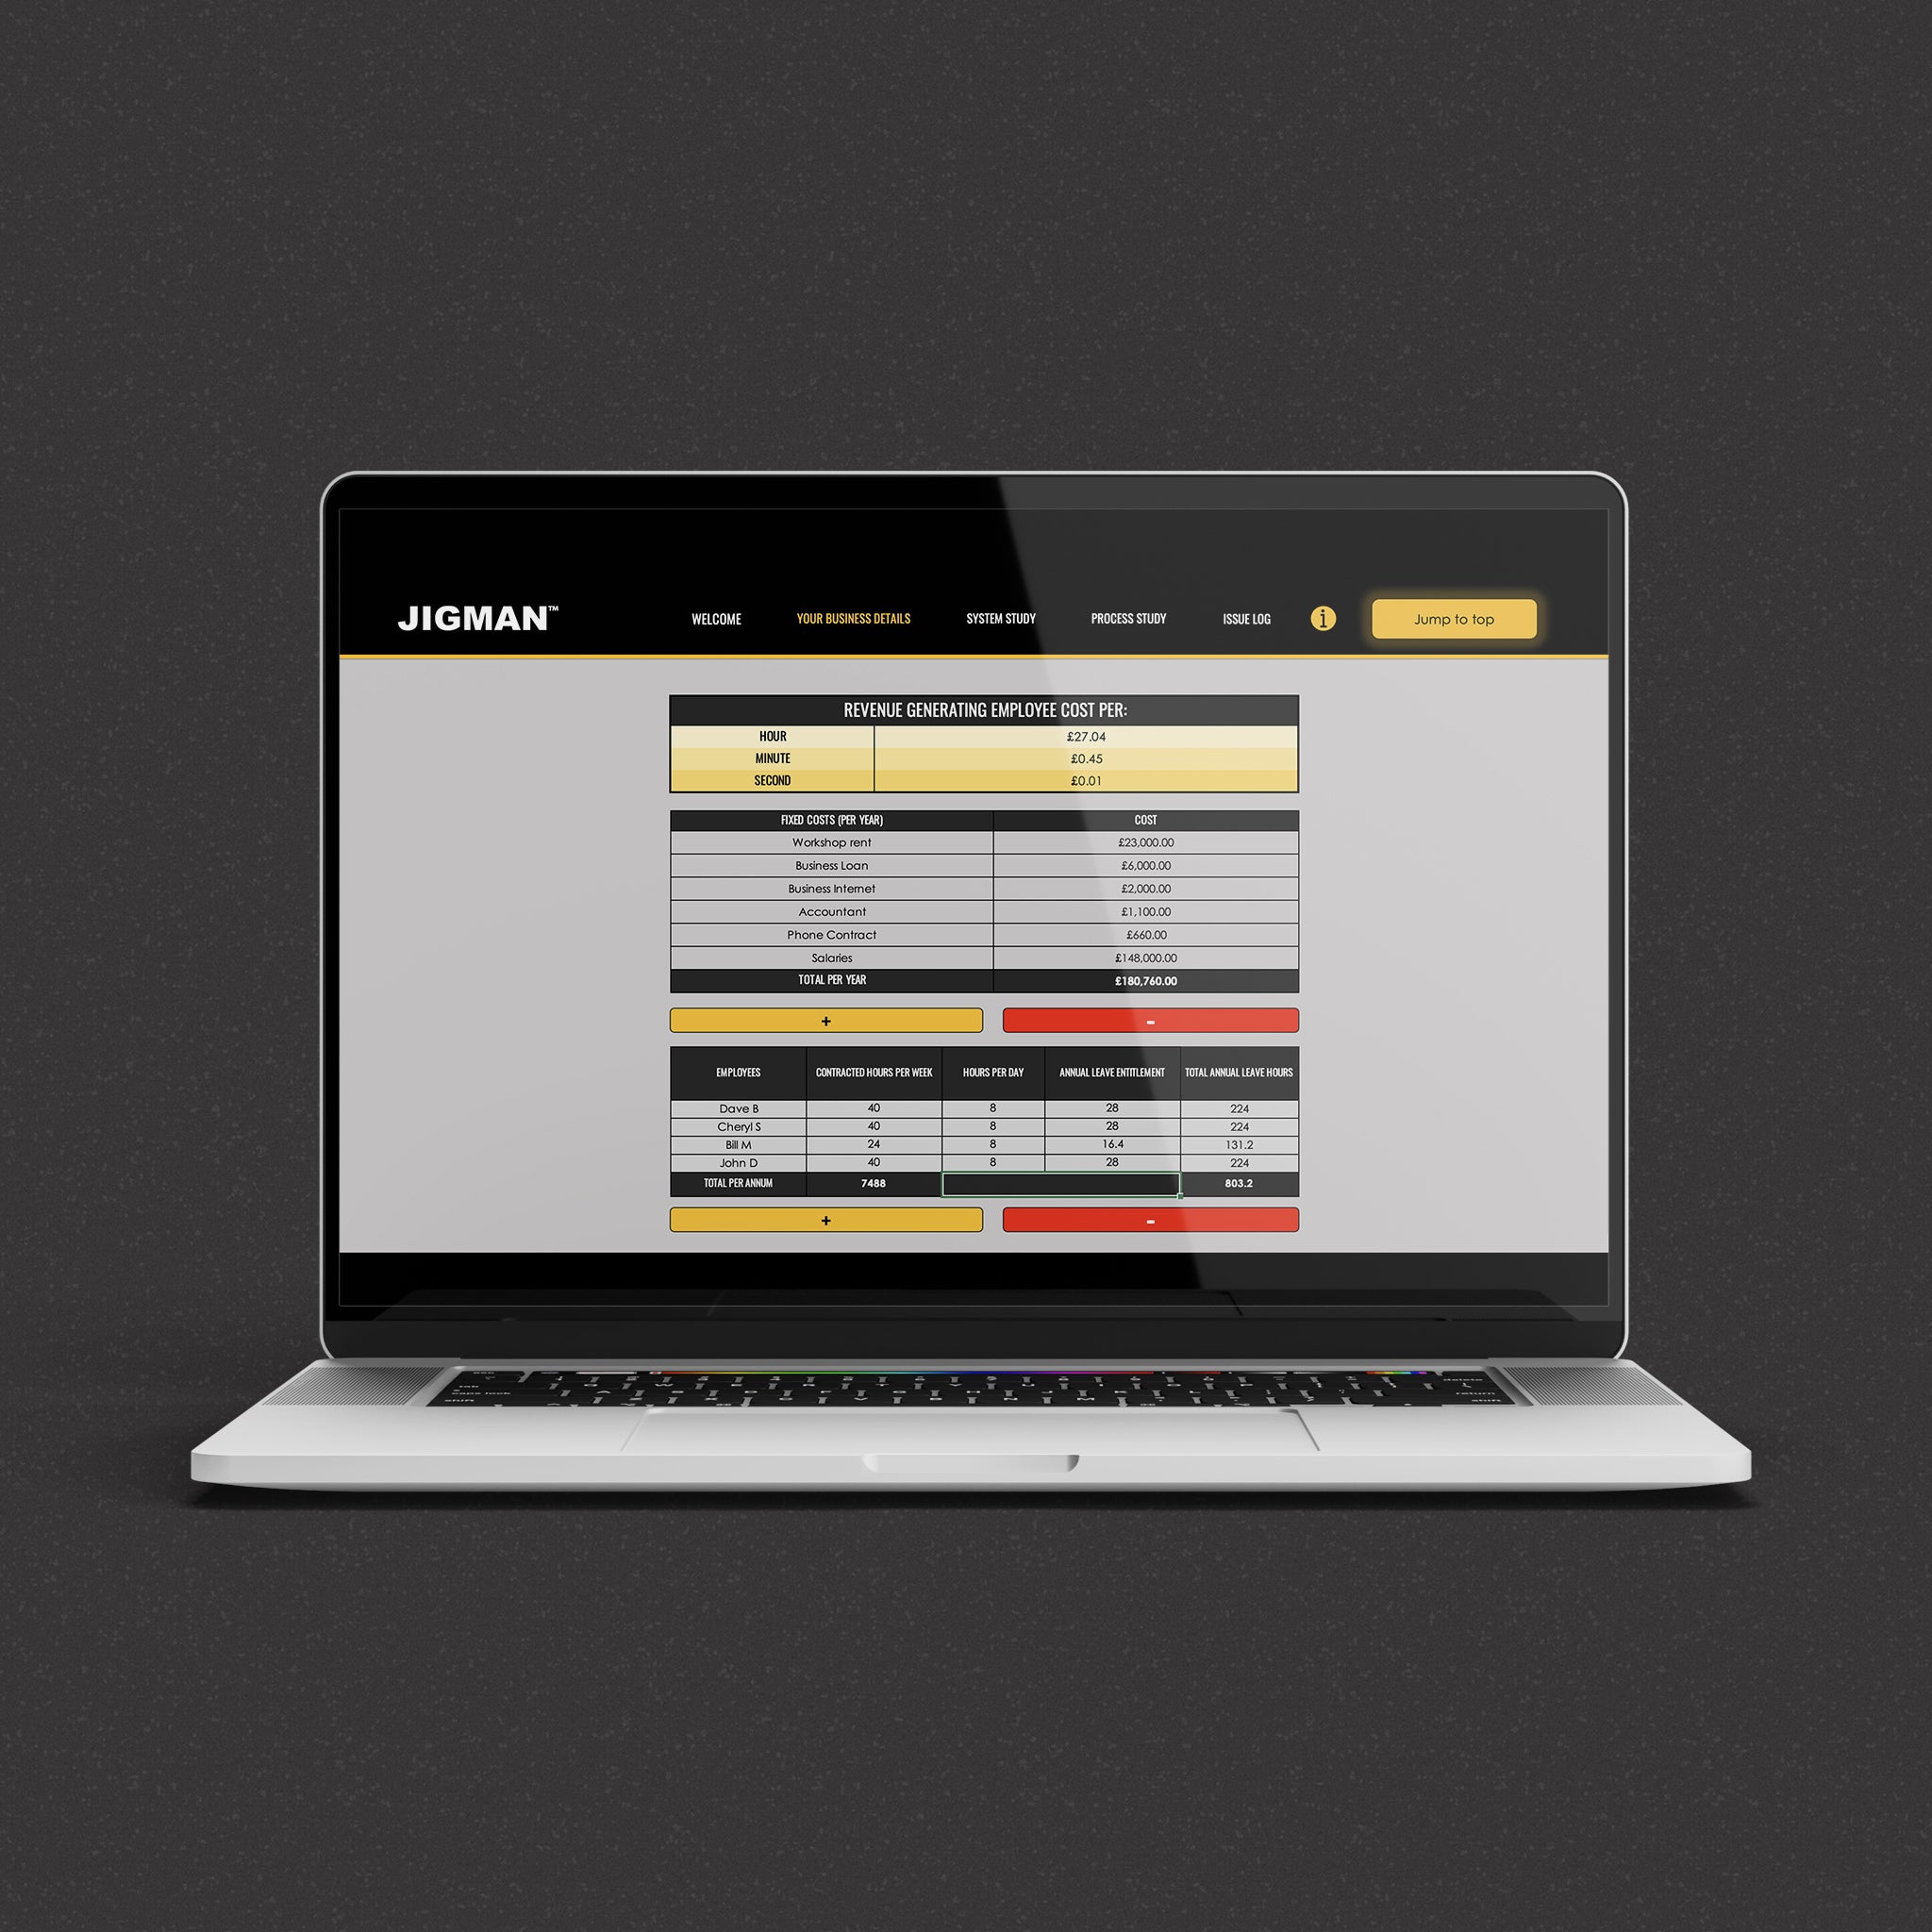
🔧 1. Business Details
Input your annual fixed costs, employee hours, and holiday allowance. The sheet will automatically calculate your cost per working hour, minute, and second.
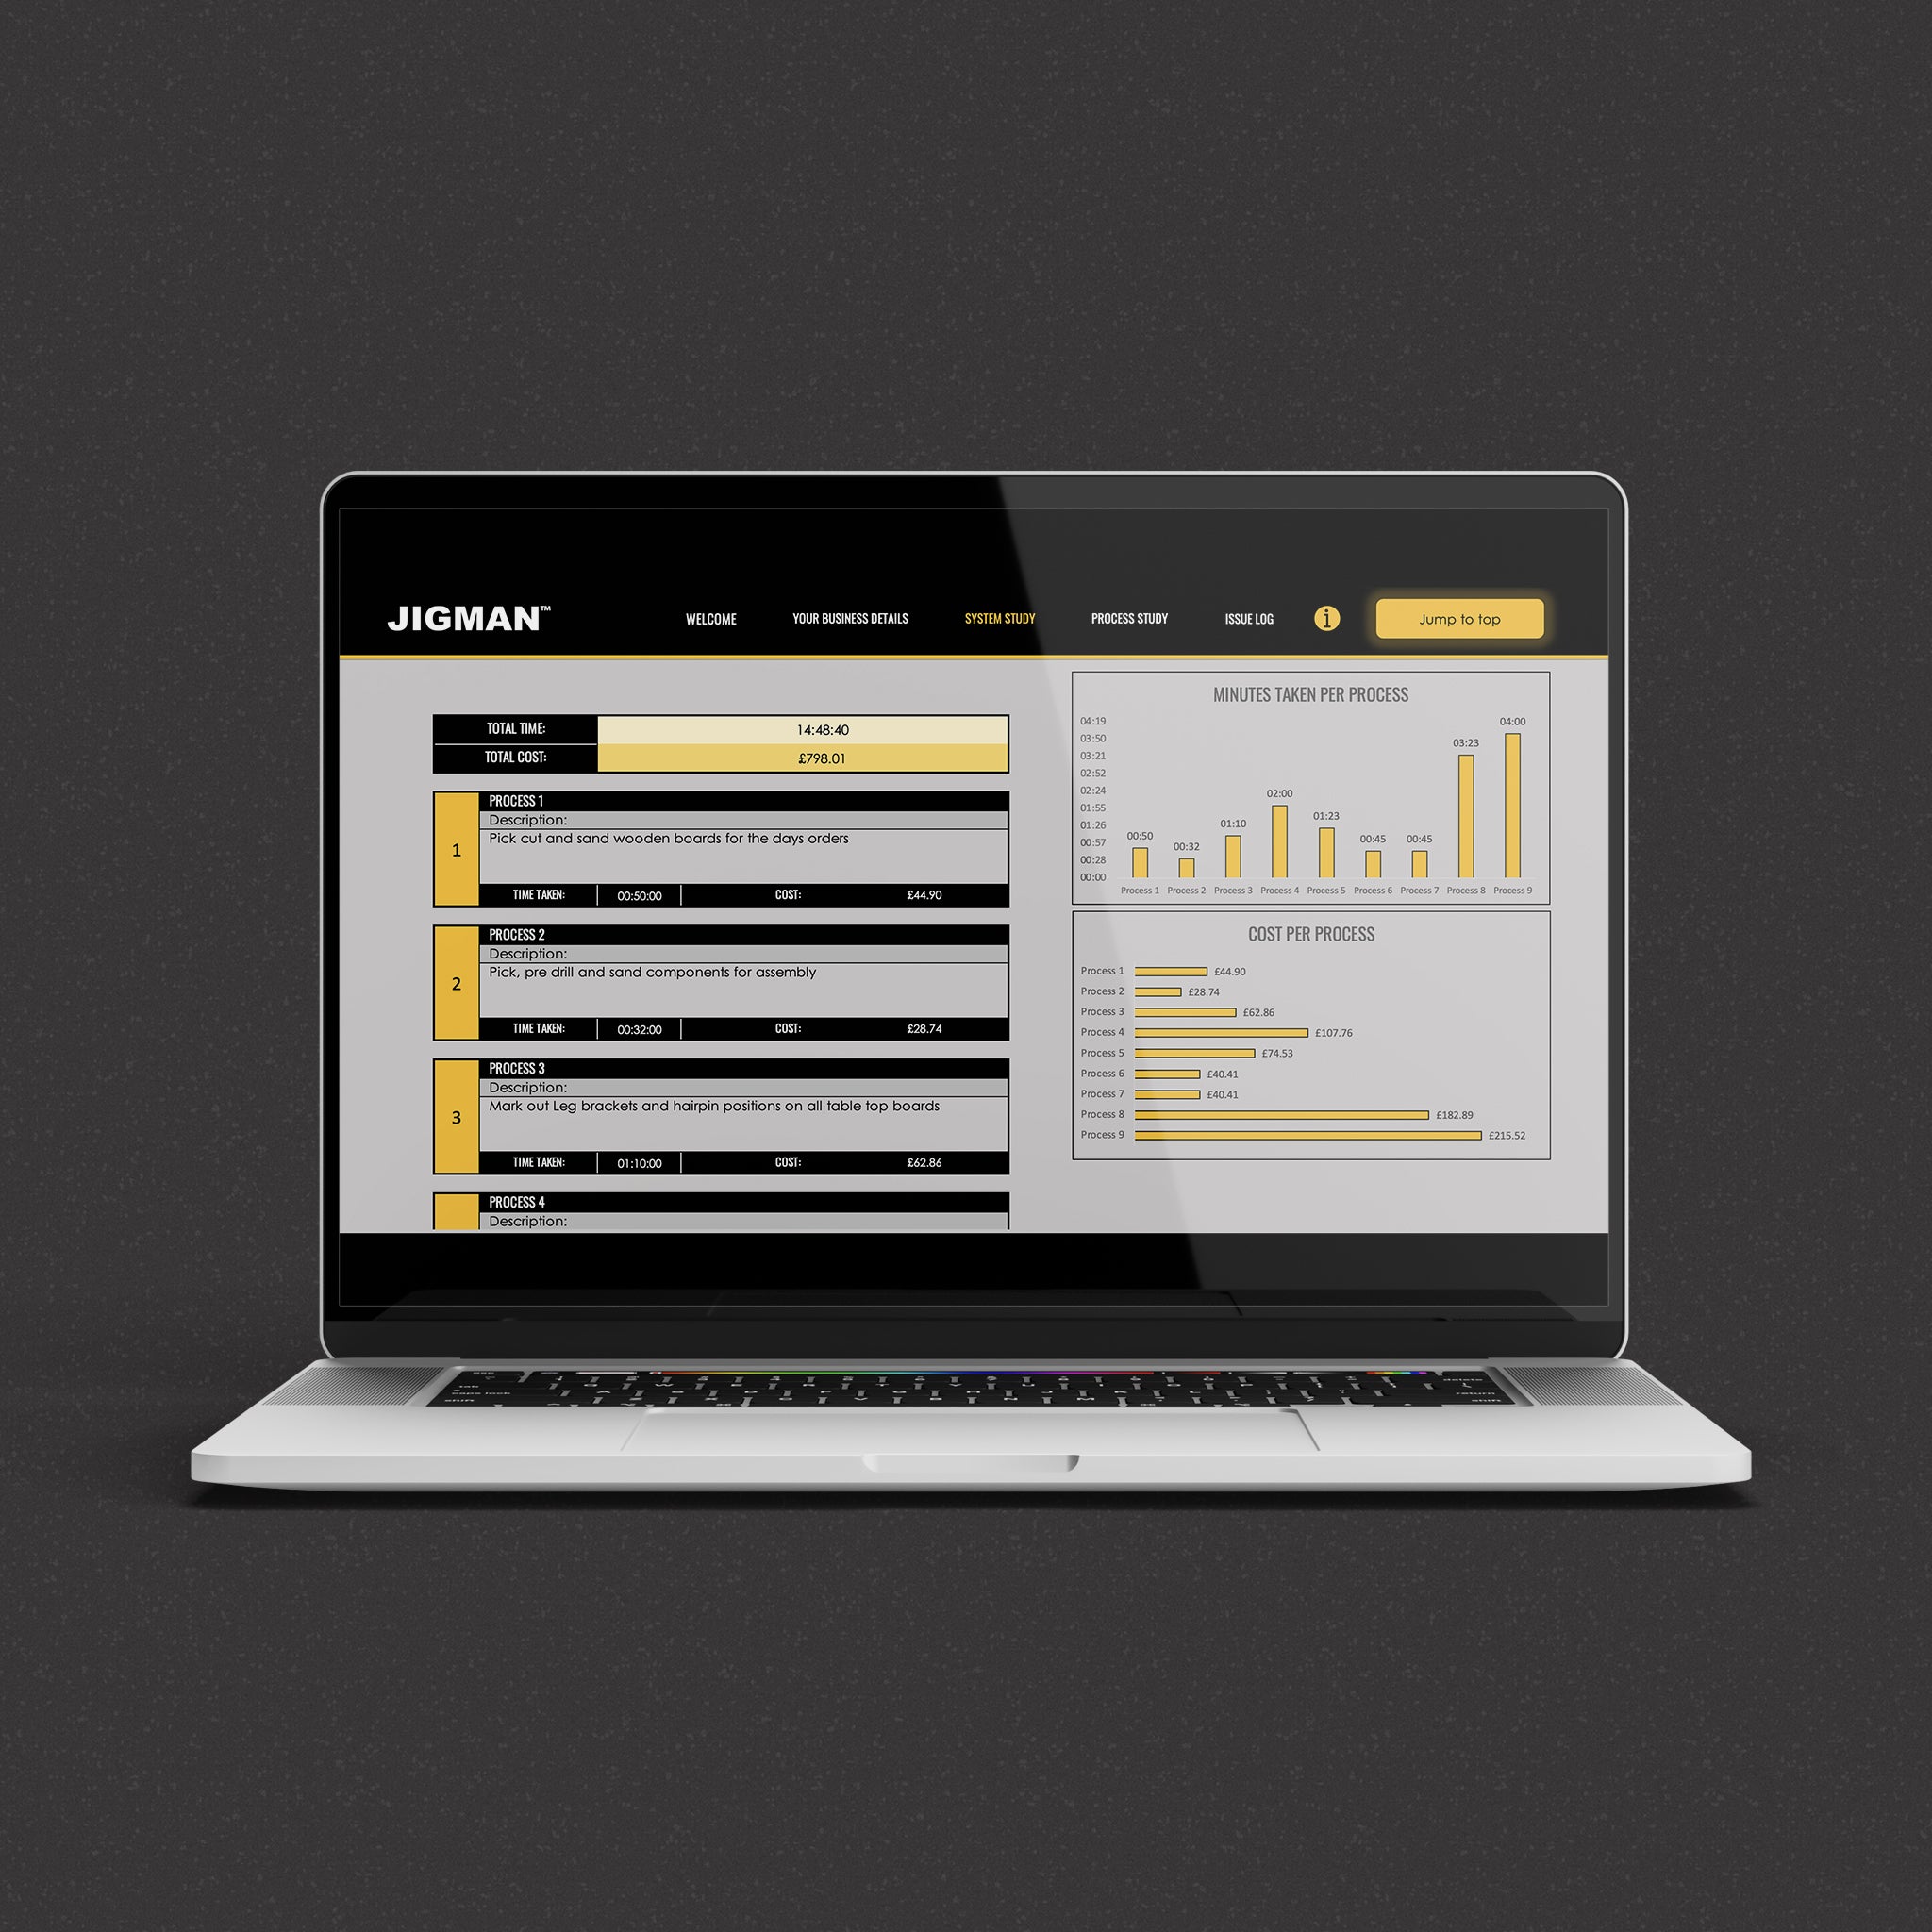
🧩 2. System Study
Map out each process in your system by time. The tool
calculates the cost per process and visually highlights bottlenecks—those slow steps that are costing you time and money.
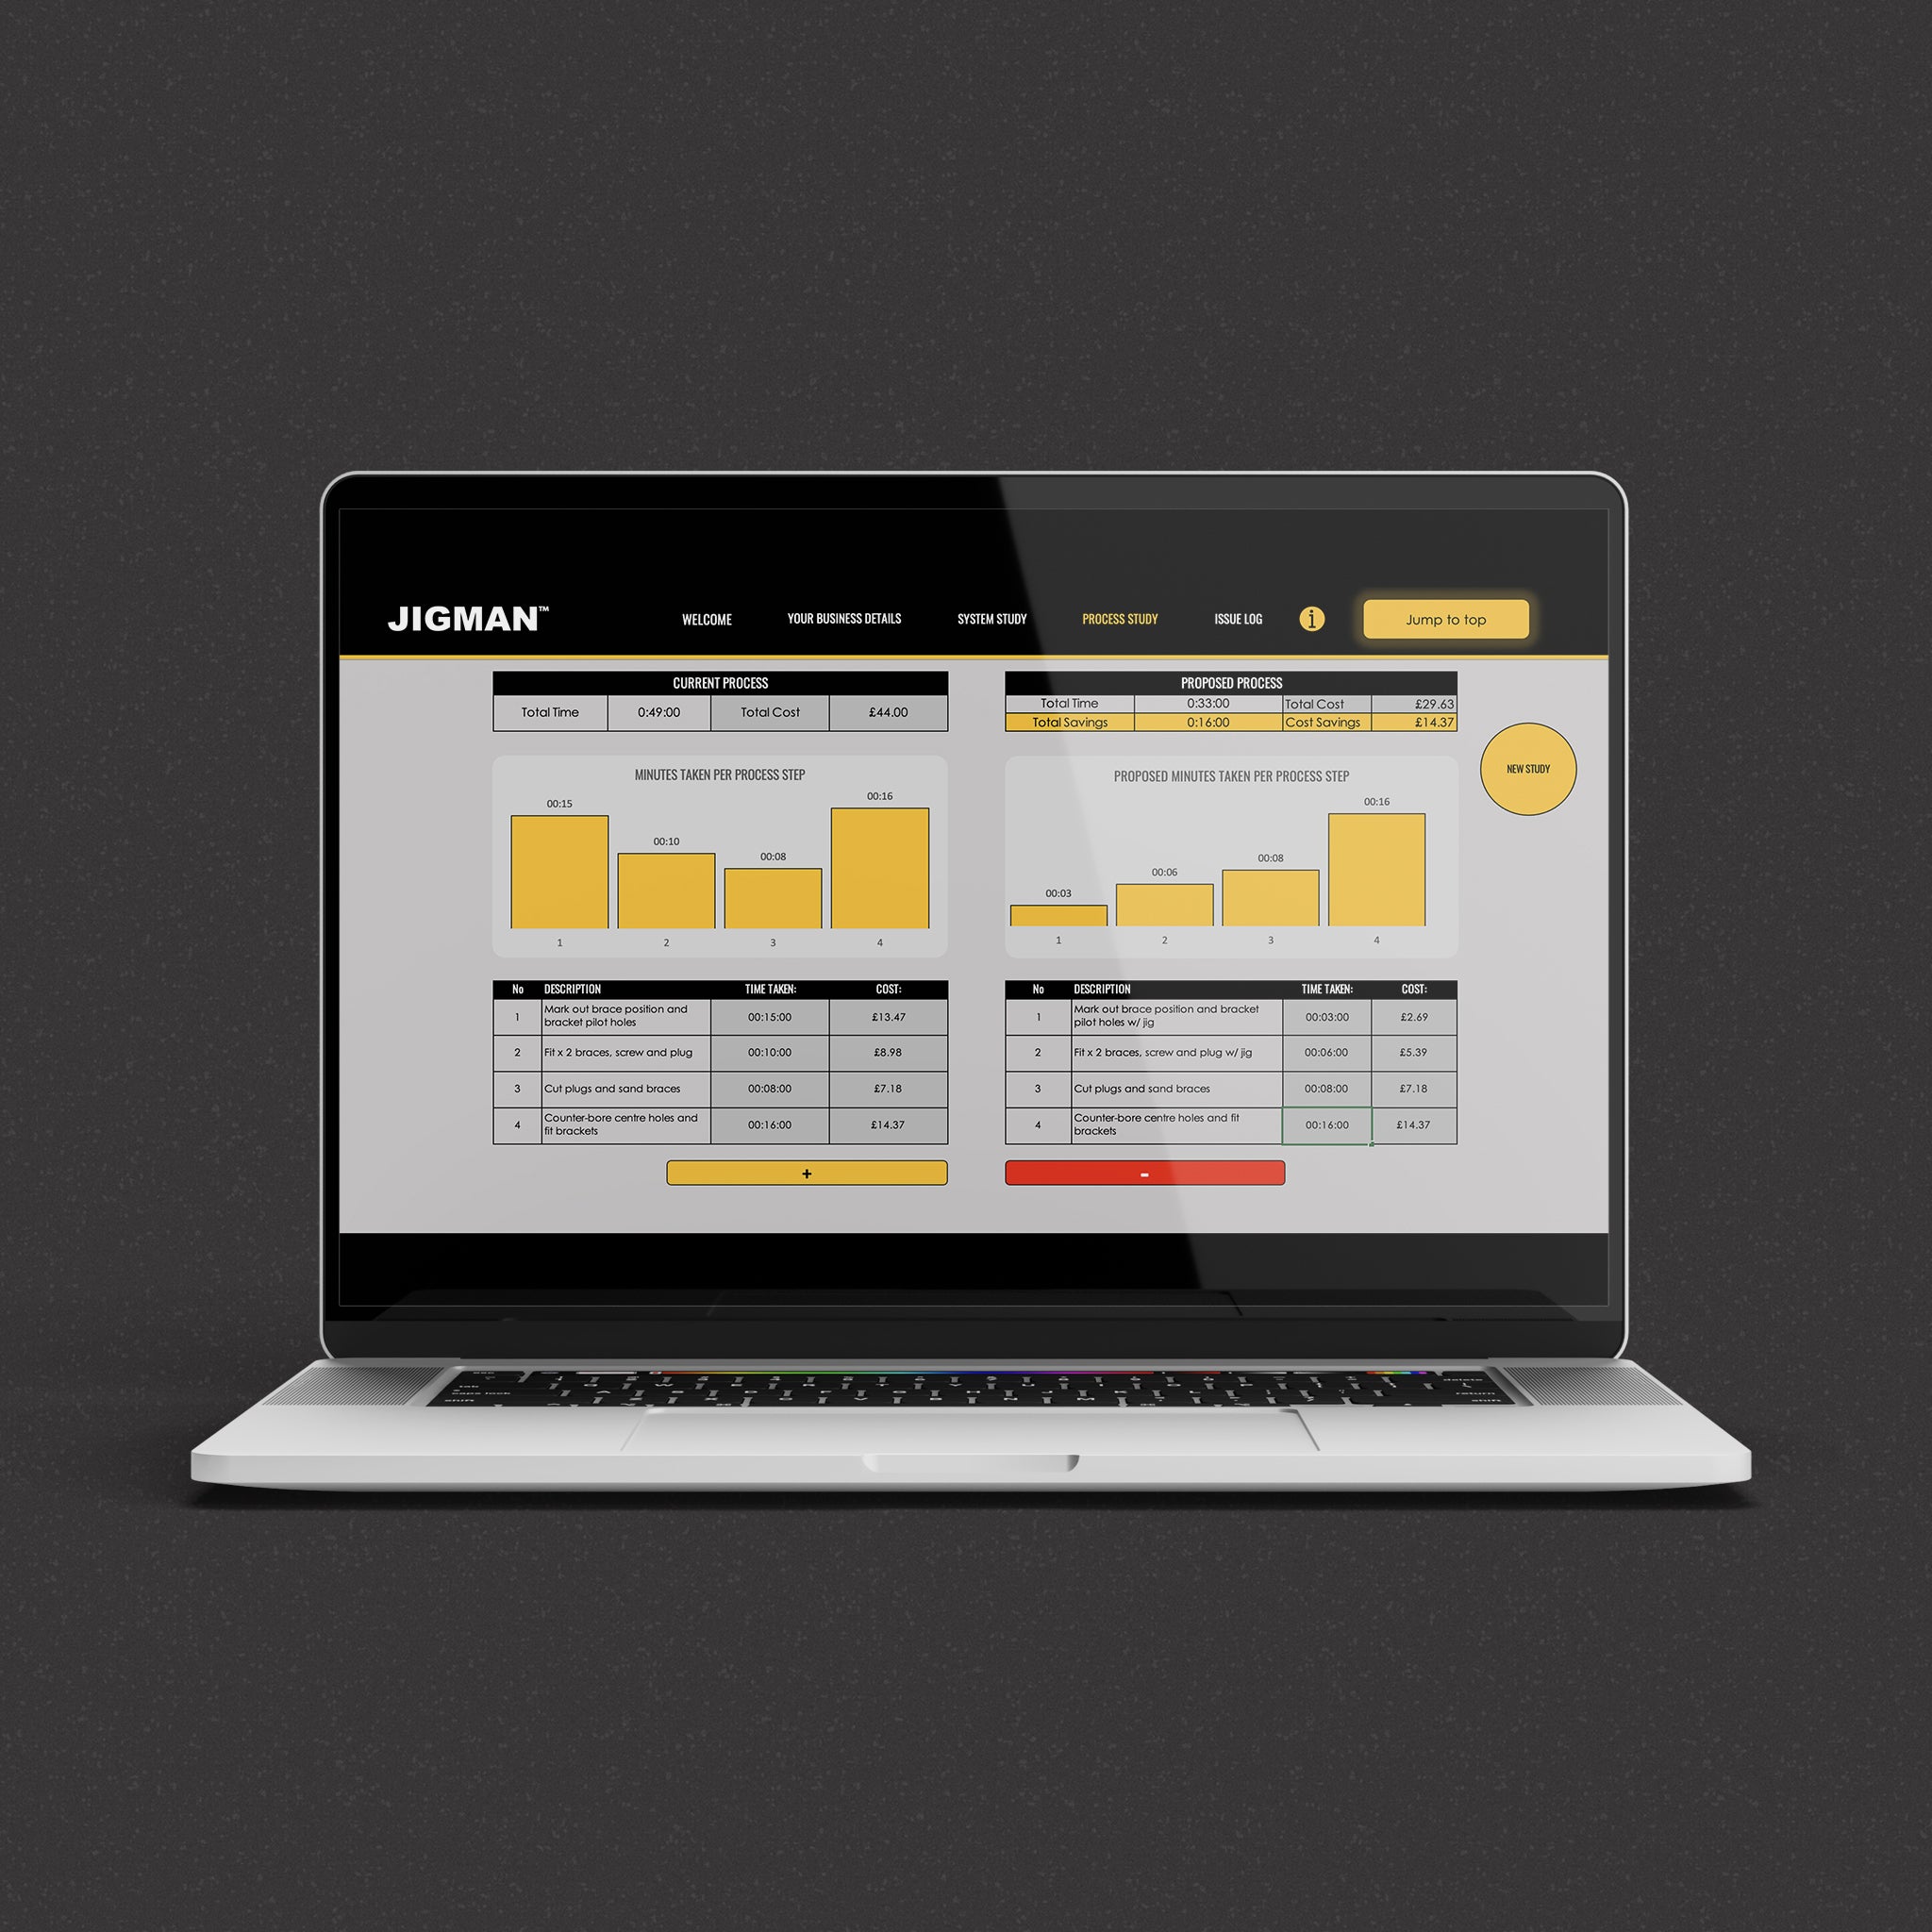
🔍 3. Process Study
Dive deeper into individual bottlenecks. Break them down
step-by-step and test improvements. The spreadsheet shows you the time and cost saved per cycle, helping you justify and prioritise changes.
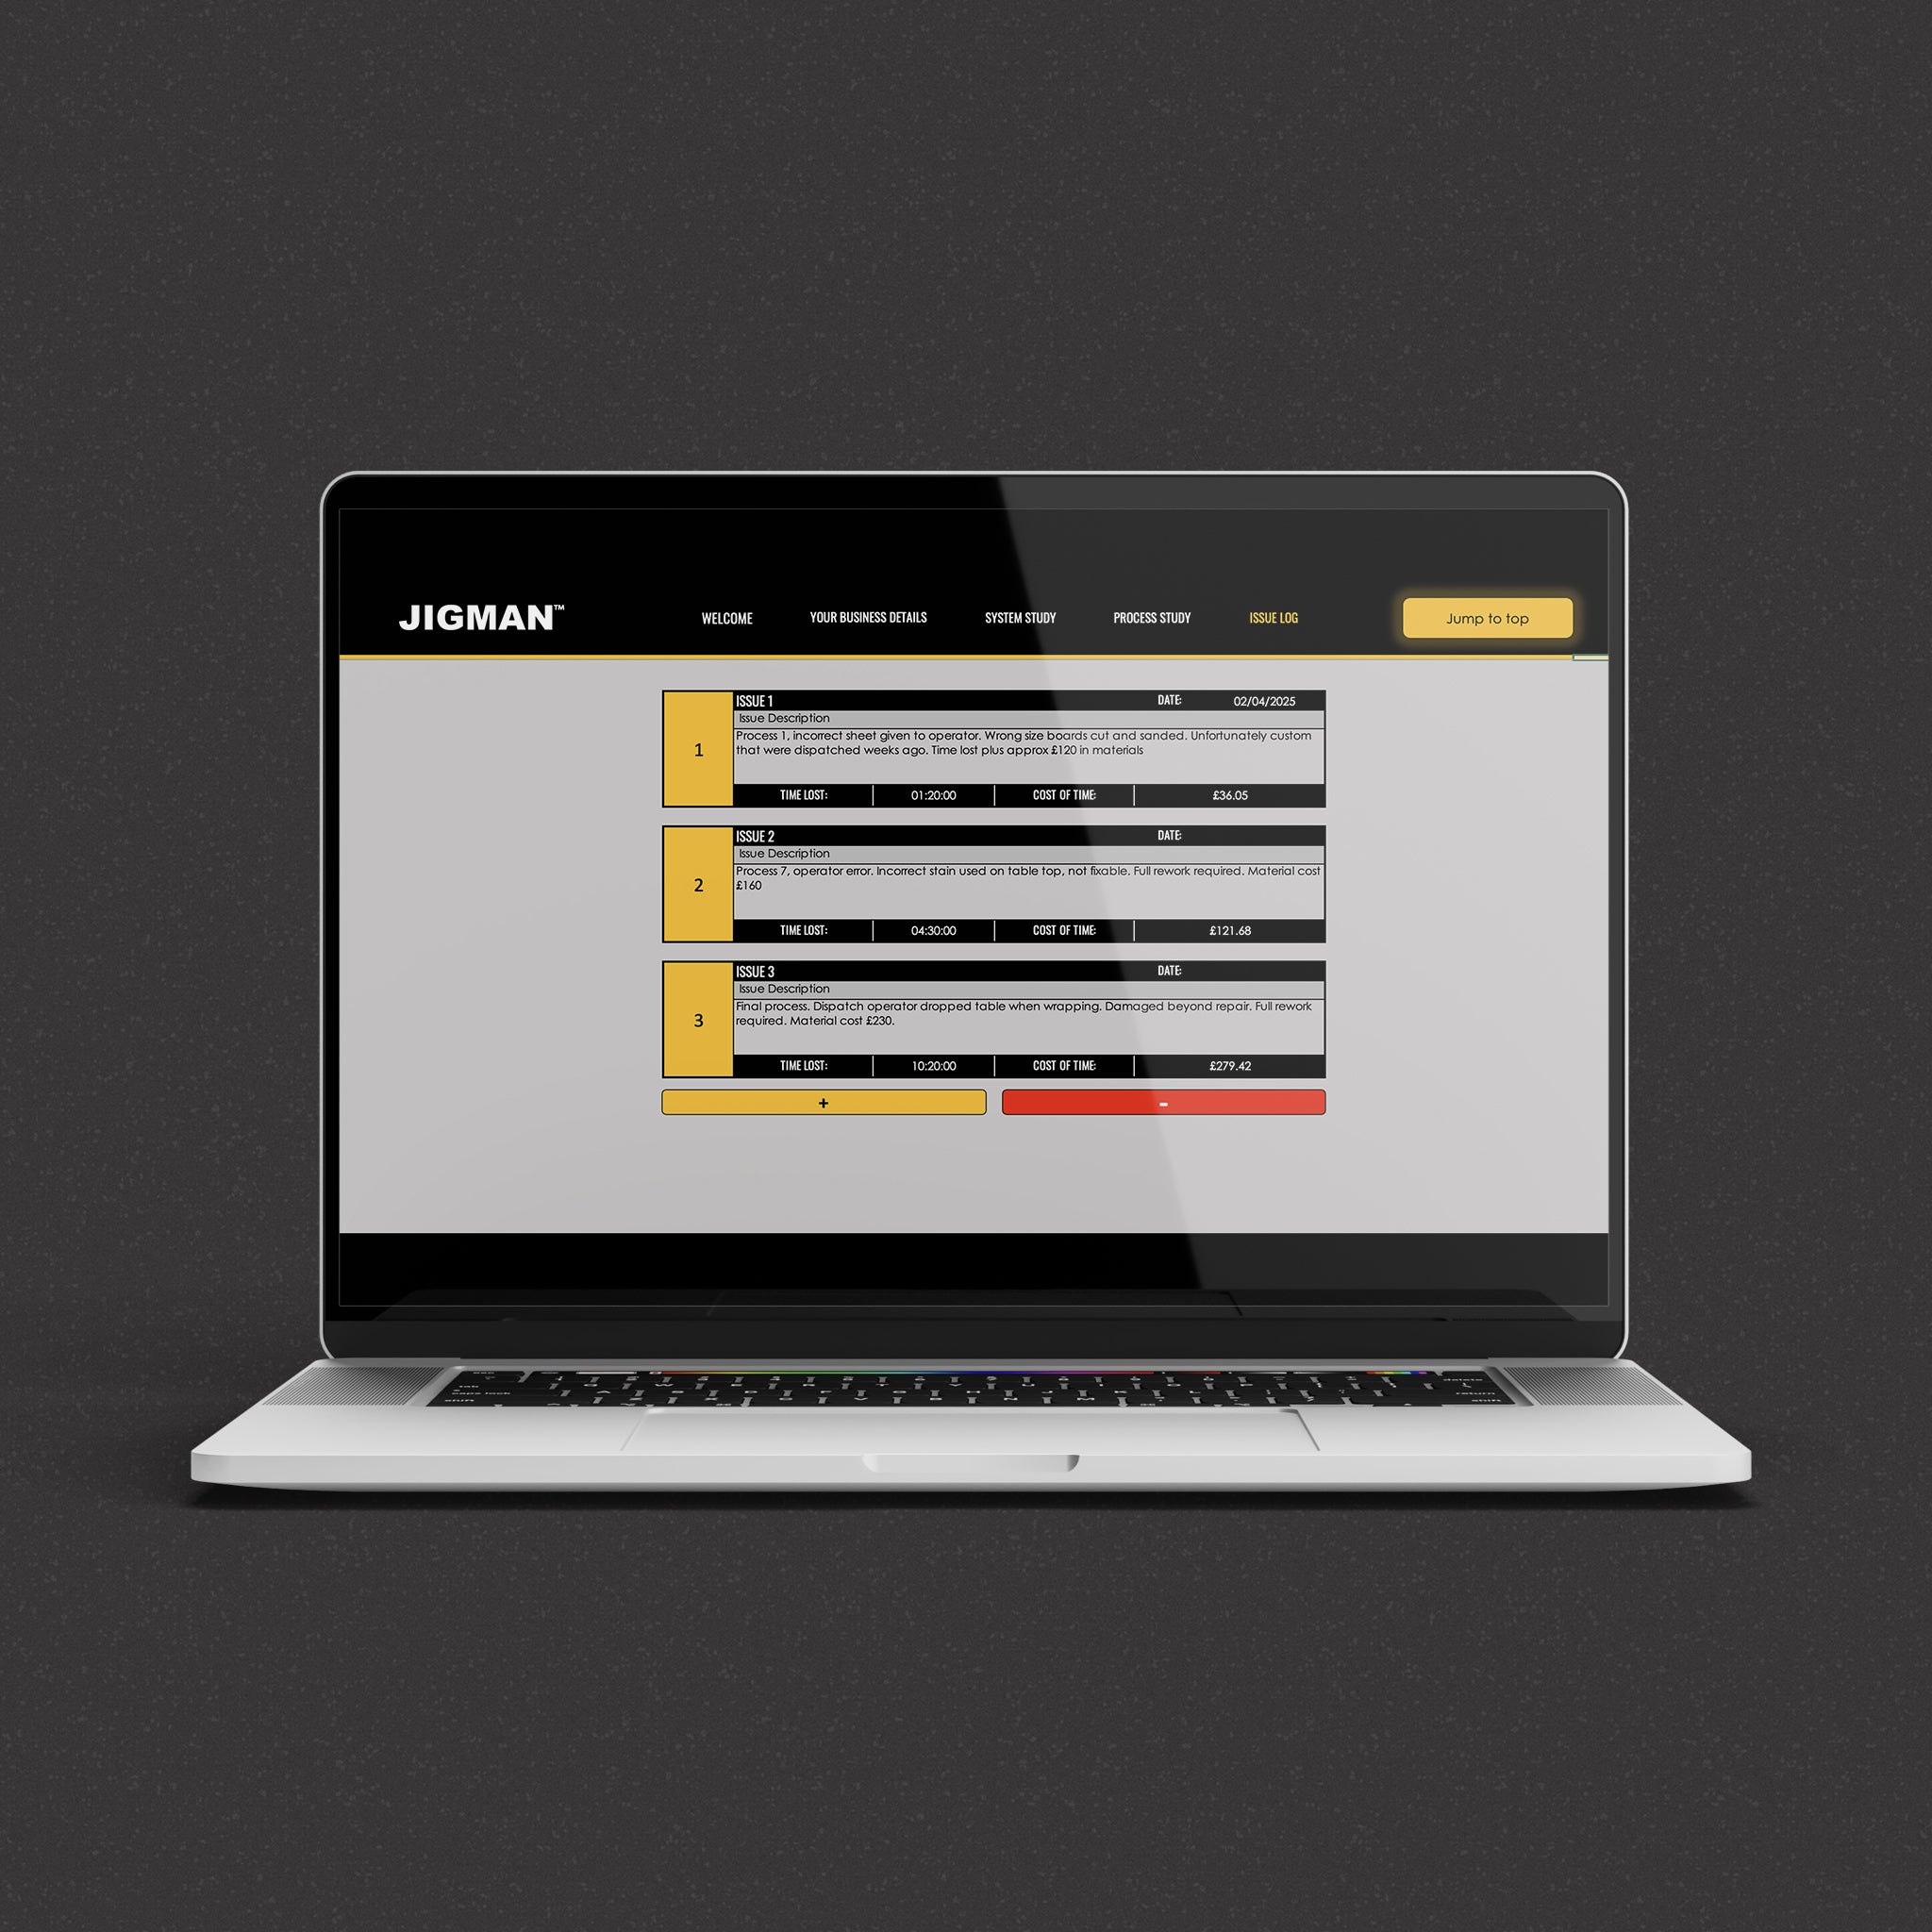
🚨 4. Issue Log
Track and quantify the cost of errors, defects, and wasted time. Perfect for pinpointing why things are taking longer than they should and what it’s really costing you.
Why it's useful
- Know your true cost per process—no more guessing.
- Quantify performance now, and model potential improvements.
- Make better business decisions with real data.
- Identify waste and hidden inefficiencies.
- Gain financial clarity and operational insight.
Who's it for?
- Small business owners
- Etsy sellers & handmade creators
- Workshop owners
- Managers of teams and small departments
- Anyone tired of vague numbers and gut-feel pricing
Built with clarity, accuracy, and simplicity in mind—so you can stop guessing and start improving.
IMPORTANT INFORMATION
This is an Excel-only document and can only be used on desktop versions of excel. This tool uses macros (code) to provide information buttons (useful pop ups), buttons to navigate through pages, buttons to add and delete sections, buttons to add new sheets, a document level zoom configurator and more, you must enable these macros for the spreadsheet to work.
The spreadsheet will not work in Google Sheets or online versions of excel. You must have an up-to-date version of Excel with macros enabled for any functionality.
Want to know more?
Press here to be shown the spreadsheet in action (further down this page).
Choose options
Key FEATURES OF THIS TOOL
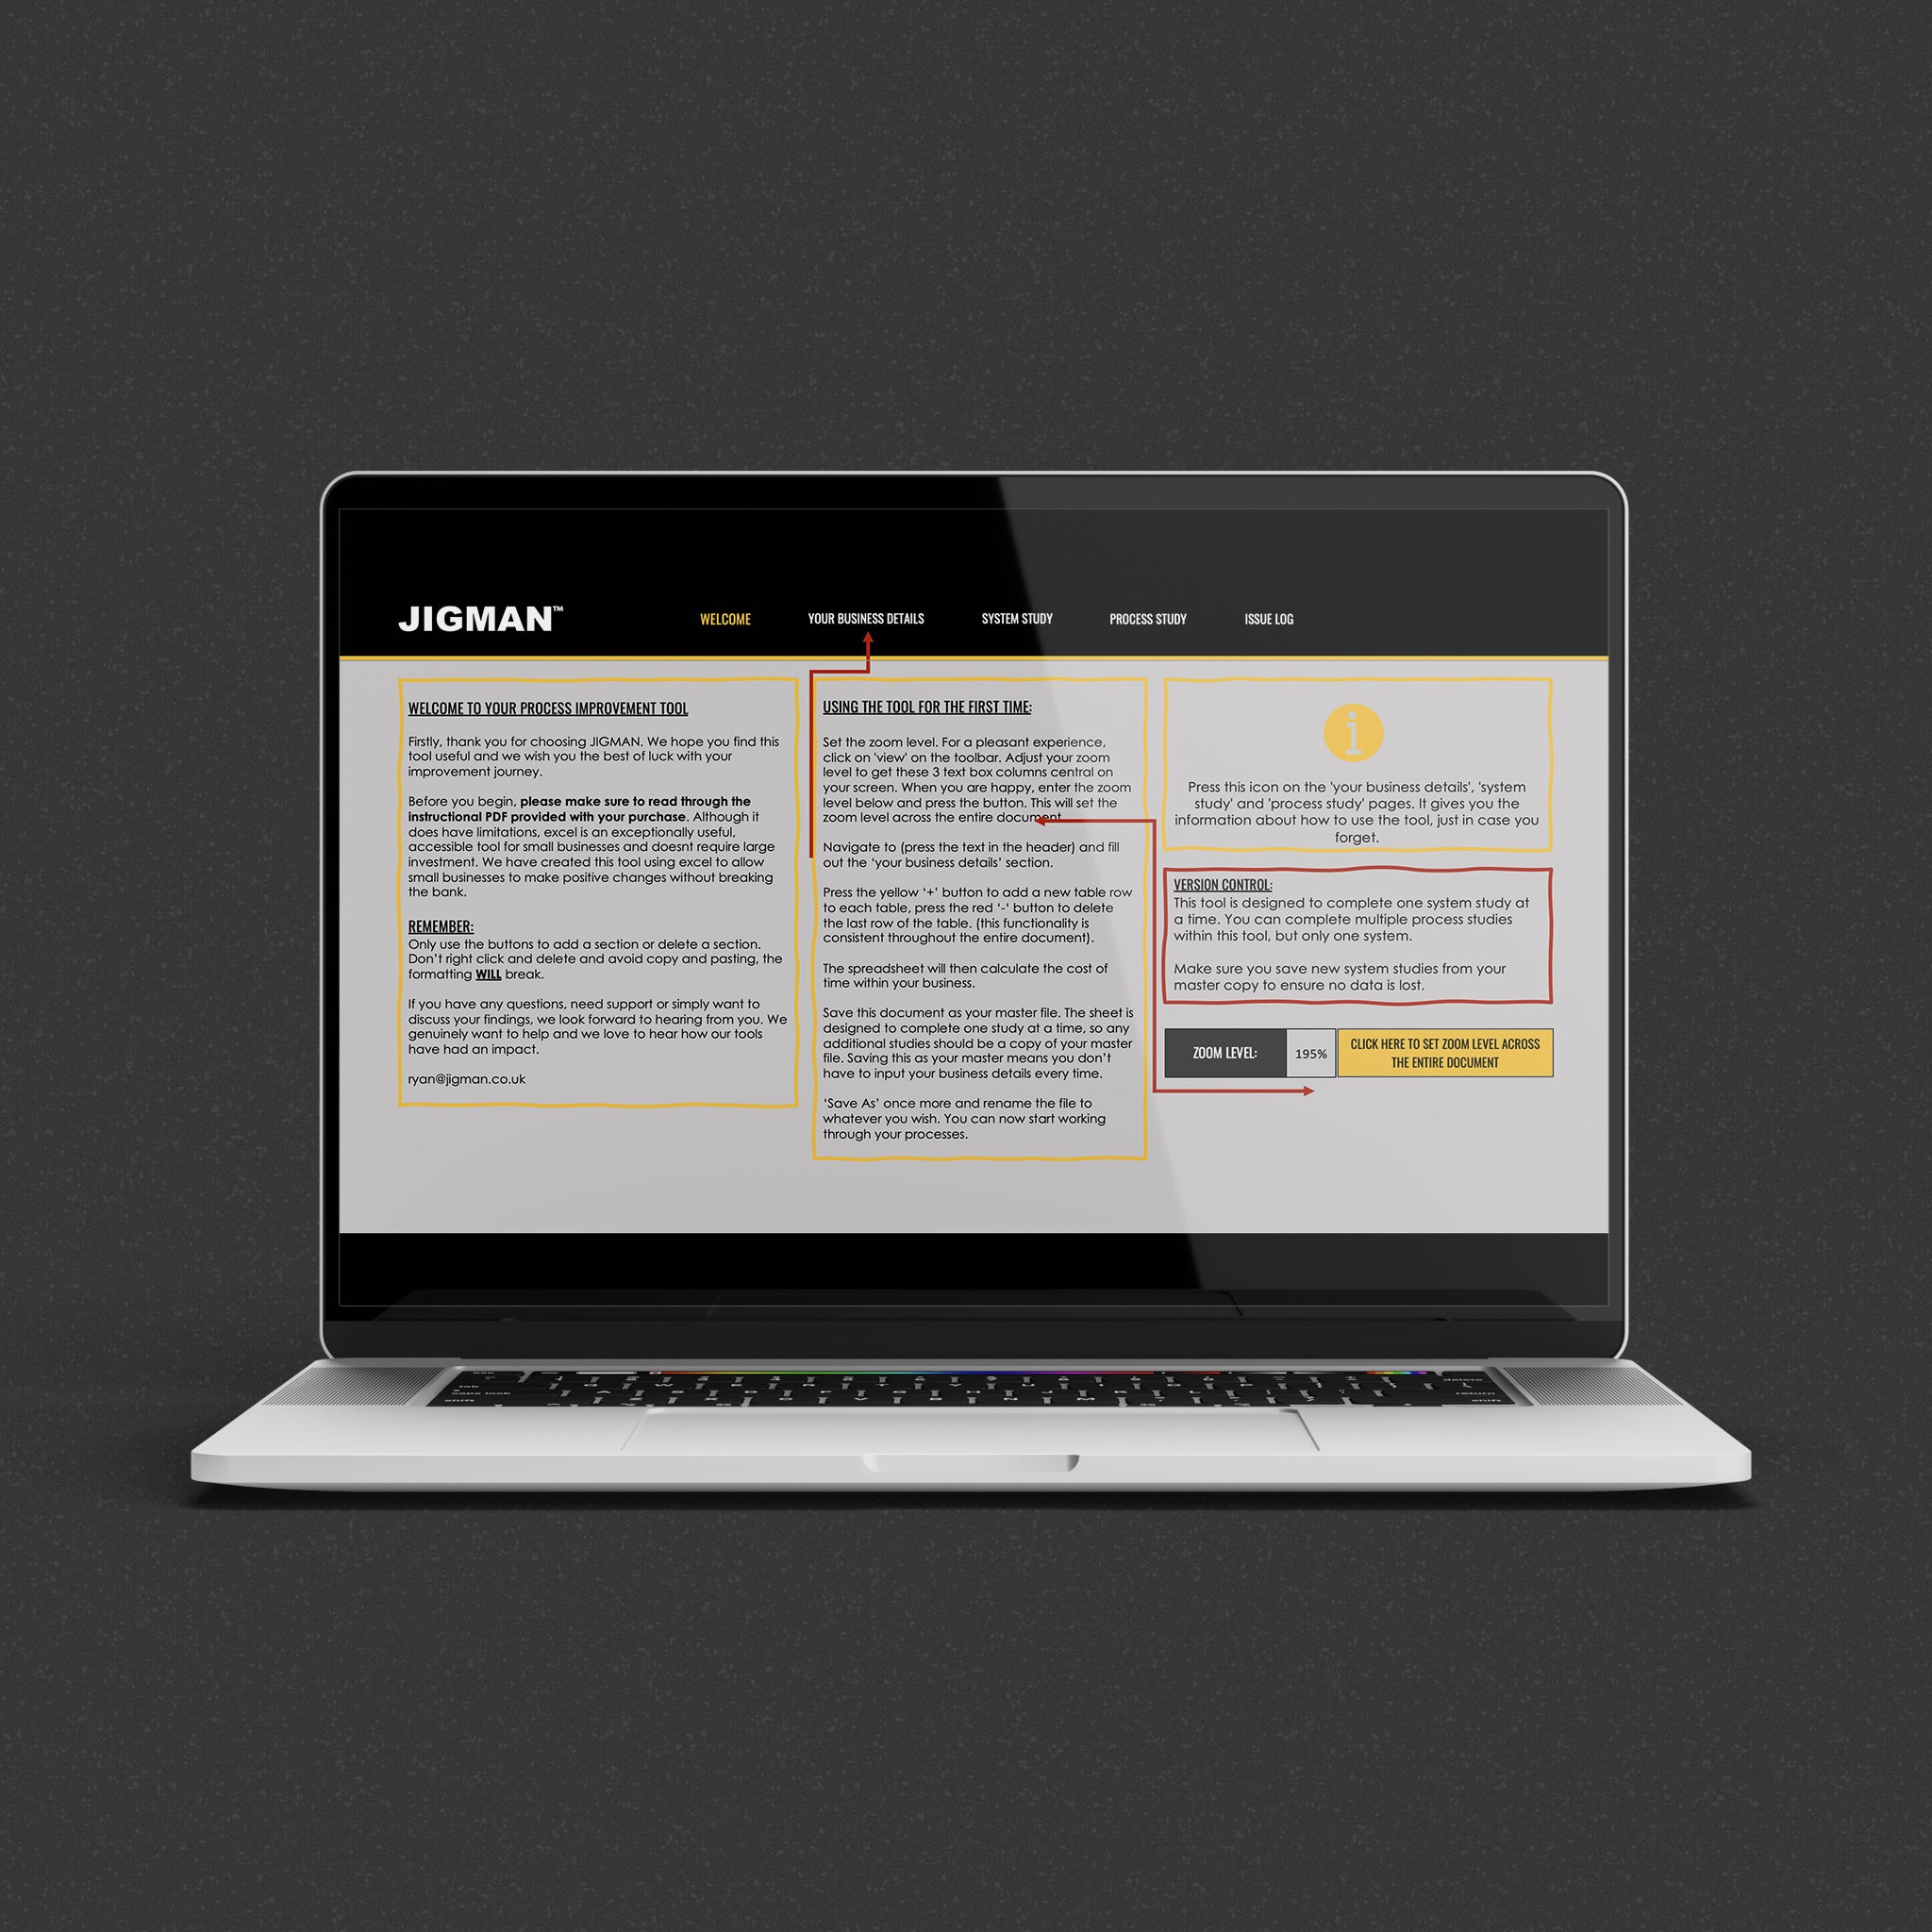
Instructional Welcome page
Hit the ground running with in depth instructions on how to use our tool. We have also included a document wide zoom configurator, Allowing for a pleasant viewing experience.
BUSINESS DETAILS TAB
Input your annual fixed costs, employee hours, and annual leave entitlement. The sheet will automatically calculate your cost per working hour, minute, and second, based only on the productive working hours available.
This data gives a value of time to your operations, and is used as the basis for all calculations throughout the tool.
Study your systems, start to finish.
Map out each process in your system by time. The tool calculates the cost per process and visually highlights bottlenecks— those slow steps that are costing you time and money.
This gives you your baseline, how you are performing now, and where in your system things are slowing you down, and costing you money.
Zoom in on the finer details, bust those bottlenecks.
Dive deeper into individual bottleneck processes. Break them down step-by-step and test improvements. The tool shows you the time and cost saved per cycle, helping you justify and prioritise changes.
Inputs on the current process auto populate the improved process table, allowing easy visualisation and improvement hypothesis without the leg work.
You can create as many process studies as you like with a handy button that adds an entirely new process study.
Track issues and defects, quantify there impact in both time and money.
The tool features an easy to use issue log. Allowing you to accurately quantify the implications of mistakes. Gather data and look for repeating issues or patterns within your operations.
When something keeps going wrong, you'll understand how much its costing.

good stuff all round...
We make a monthly donation to Ecologi for tree planting in the UK and abroad. Ecologi also fund renewable energy projects and forest conservation.
Do you need any more help?
Please get in touch, we look forward to hearing from you.